
[[{“value”:”
Hi everyone! 👋
Ready to transform your raw data into beautiful, interactive reports—without needing to be a data pro?
Today, we’re unlocking a killer method: how to use AI to whip up any kind of report you want, directly in Google Sheets.
Whether you’re brand-new to analytics or just looking to speed up your workflow, this quick guide will show you exactly how to get started.
Let’s dive in!
🚨 What You’ll Need
-
A Google Sheet containing your raw data.
-
An AI tool (e.g., Claude, ChatGPT, or DeepSeek).
-
A clear prompt that tells the AI:
-
To act as a “data analyst expert.”
-
What columns you have in your raw data sheet.
-
How you want the final report arranged.
-
-
Apps Script access (which comes with Google Sheets).
Step 1: Set Up Your Raw Data
-
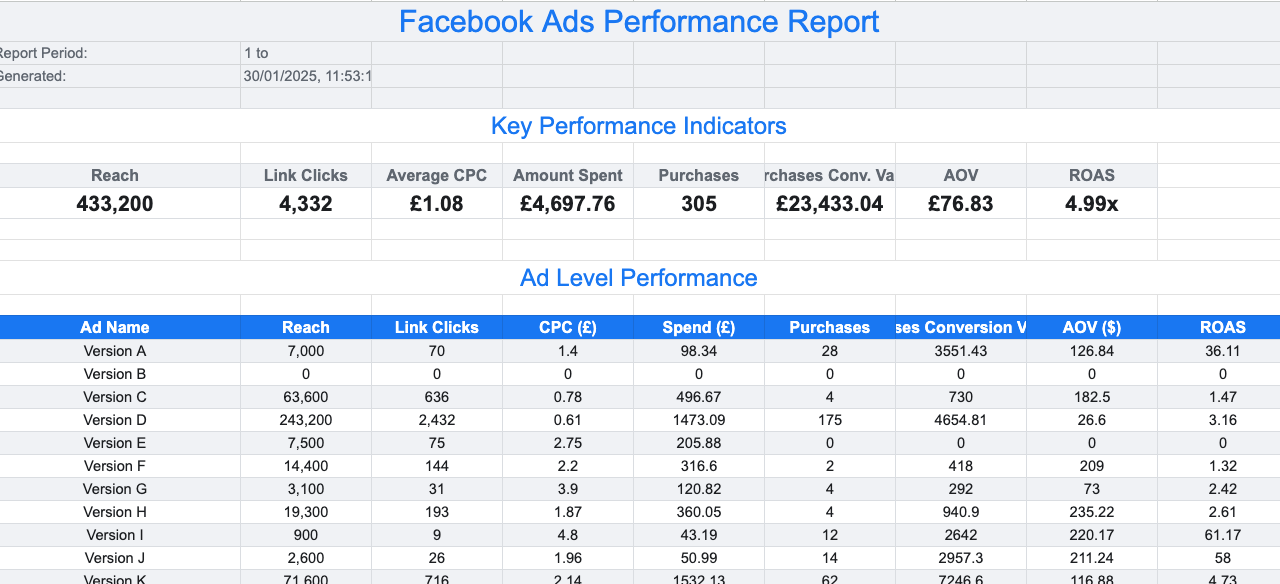
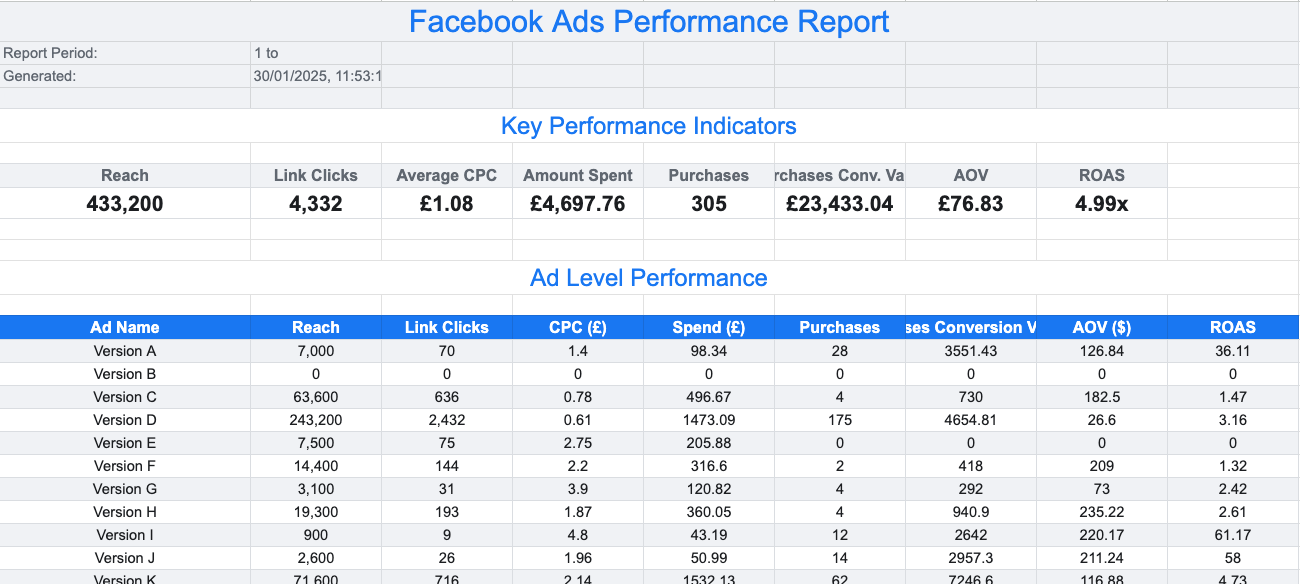
Create or open a Google Sheet where you have your raw data (e.g., Facebook Ads info).
-
Columns might include Date, Campaign Name, Ad Set Name, Ad Name, Spend, Impressions, Clicks, Conversions, etc.
-
-
Label the sheet tab that contains the raw data.
-
For example, name the tab
Raw Data.
-
-
Verify column headers so you can accurately reference them when you instruct the AI.
Tip: If your data is confidential, consider providing only the column headers (not the actual data) when you prompt the AI.
Step 2: Craft Your AI Prompt
“}]] Read More in The AI Break


