
[[{“value”:”
Hey AI Breakers 👋
Every export you download ends the same way. Forty columns, a scroll, a guess, and a question you still can’t answer.
Today you’ll build The Numbers Desk: three Claude Skills that turn any spreadsheet export into the report you’d pay an analyst $3K a month for. No code and no terminal: you upload them once and they never guess.
-
✅ A METRICS CORE block that tells Claude which 5 numbers actually run your business
-
✅ An EXPORT MAP for every file you download, so the formulas are fixed before any number is quoted
-
✅ The Report Desk skill: drop in an export, get a one-page owner report with the maths shown
-
✅ The Delta Watch skill: what changed since last period, ranked by money, timing noise removed
-
✅ Ask the File skill: plain-English questions, computed answers, one honest chart
Let’s build it 👇

🧠 How The Numbers Desk Works
A good analyst does three things before touching a chart: learns what you measure, learns what your files look like, and checks the file before trusting it. The desk does the same, in this order:
-
🧾 Prompt #1 builds your METRICS CORE (the 5 numbers, their definitions, your traps)
-
🗂️ Prompt #2 builds an EXPORT MAP per file (what a row means, which column is money, the exact formulas)
-
📊 Skill #1 checks the file, then writes the monthly report
-
📈 Skill #2 explains what changed and separates timing from performance
-
❓ Skill #3 answers any question with the calculation shown
-
🔁 Prompt #3 turns your corrections into permanent rules
⚙️ The 30-Second Install (Do This First)
Each skill below is one small text file named SKILL.md, sitting in its own folder.
This is what one looks like:
---
name: report-desk
description: Turns any spreadsheet export into a one-page owner report using our own metric definitions. Use when the user uploads or mentions a CSV, Excel file, export, or asks for a report or summary of their numbers.
---

[the instructions go here]
The description line does the triggering. It’s how Claude knows to load the skill without you asking.
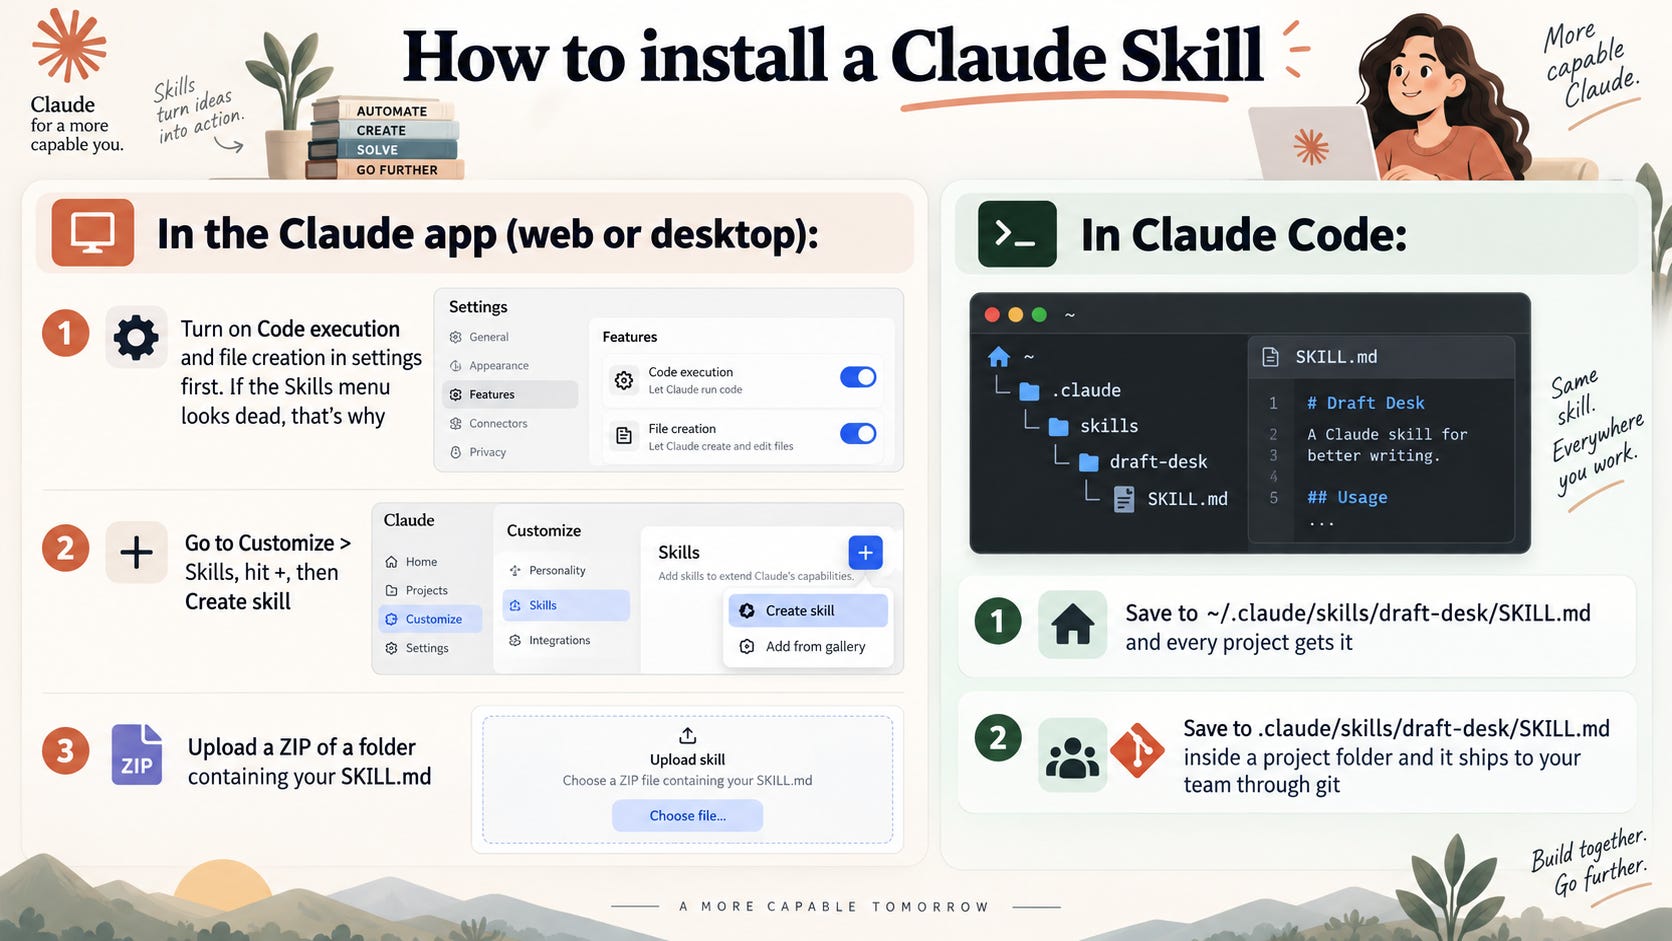
In the Claude app (web or desktop):
-
⚙️ Switch on Code execution and file creation in settings before anything else. If the Skills menu looks dead, that’s the reason
-
➕ Open Customize > Skills, hit +, then Create skill
-
📦 Upload a ZIP of the folder that holds your SKILL.md
In Claude Code:
-
🏠 Save it to ~/.claude/skills/report-desk/SKILL.md and every project picks it up
-
📁 Save it to .claude/skills/report-desk/SKILL.md inside a project and it travels to your team through git
💡 Tip: the quickest route of all is to paste the skill text into Claude and ask it to save it as a skill file for you.
🧾 Prompt #1 → The Metrics Core Builder (the context every report reads)
Your analyst’s real value was knowing which numbers matter to you and which ones are noise. Build that knowledge once, here.
The goal:
-
The 5 numbers you actually decide with, defined in your words
-
The direction and target for each, so the desk can say on track or off track
-
Every trap in your data, named before it bites
✅ Use this to generate the METRICS CORE block you’ll paste into all three skills.
Prompt:
You are a business analyst who writes context briefs that other AI systems will use to report on a company's numbers.

Interview me to build a "METRICS CORE" for my business.

Ask these 8 questions ONE AT A TIME. Wait for my answer before asking the next one. Do not summarize until the end.

1. What do you sell, and how does the money arrive? (subscriptions, one-off orders, invoices, ad revenue, a mix)
2. If you could only see 5 numbers each month, which 5? Define each one in a single line, in your own words.
3. For each of those 5: is up good or bad, and what is the target or the "normal" range right now?
4. How often do you review numbers, and on which day? (weekly Monday, monthly on the 1st, before a board call)
5. Which exports do you actually download today? Name the tool and the file. (Stripe payments, Shopify orders, GA4 traffic, Meta Ads, your CRM, the bank statement)
6. Known traps in your data: refunds, test orders, internal users, multiple currencies, annual plans billed upfront, time zones, duplicate rows. List every one you know about.
7. Who reads the report, and how many minutes do they give it?
8. What is the one decision you make every month from these numbers?

After my final answer, output a single block titled "METRICS CORE" containing:
- Business model: one line
- The 5 numbers: for each, its name, a one-line definition, the direction that is good, and the target or normal range
- Review cadence: when, and by whom
- Sources: each export, the tool it comes from, and how often it is pulled
- Exclusions and traps: bullet list, each with how to recognise it in a file
- Reader: who, and the time they have
- Monthly decision: one line

Keep the whole block under 350 words. Write it so an analyst who has never met me could compute my numbers without asking a question.
💡 Tip: answer question 2 with the numbers you already check by hand, not the ones you think you should. A desk that reports what you ignore gets ignored.
🗂️ Prompt #2 → The Export Map (the formulas, fixed before any number is quoted)
Most bad reports come from a good analyst reading the wrong column. This prompt pins every formula to the actual file, once per export.
The goal:
-
What one row means, which column is the date, which column is money
-
The exact filter that removes refunds, test rows and internal users
-
The formula for each of your 5 numbers from this specific file, or an honest “not in this file”
✅ Use this to build one EXPORT MAP per export. Stripe, Shopify, GA4, ads, CRM, bank: each gets its own.
Prompt:
You are a data analyst who documents spreadsheet exports so that other AI systems can compute business metrics from them without guessing.

Here is my METRICS CORE:
[paste the METRICS CORE block from Prompt #1]

Here is one export. I am pasting the header row plus 5 sample rows, with any names or emails replaced by placeholders:
[paste the header row and 5 sample rows from one file, and name the tool it came from]

Do this:
1. State what one row represents. (one payment, one order, one session, one ad, one bank line)
2. Identify the date column. State its format and time zone if visible. If there are several date columns, pick the one that should drive period reporting and say why.
3. Identify every money column. State the currency and the sign convention: are refunds negative rows, separate rows, or a separate column?
4. Identify the ID columns (customer, order, subscription) and the category columns worth grouping by (plan, product, channel, country, status).
5. List the rows that must be excluded before any metric is computed, and the exact filter that removes them. Use the traps from the METRICS CORE.
6. For each of the 5 numbers in the METRICS CORE, write the exact formula from THIS file: which rows, which column, which operation. If a number cannot be computed from this file, write "not in this file" and name the export that would have it.

Output a block titled "EXPORT MAP: [tool name]" with six sections matching the steps above. Under 300 words. Formulas must be precise enough to follow without judgement.

Repeat this prompt once per export.
🧠 Tip: replace names and emails with placeholders before you paste sample rows. The map only needs the column shapes, never the identities.
📊 Skill #1 → The Report Desk (the monthly report, in 4 minutes)
This is the skill that does the $3K a month job. It checks the file, applies your exclusions, computes your 5 numbers, and writes the same one-page report every time.
The goal:
-
A fixed template your reader learns once and skims forever
-
Every number computed from the rows, with its formula printed underneath
-
Timing separated from performance before anything is called a trend
✅ Use this on any export the day it lands. One file in, one page out.
Prompt: save everything below as report-desk/SKILL.md
“}]] Read More in The AI Break